Device is slowing down/locking up.

I've been using your new Theme manager and it's been working great and have been running off a custom theme!
However, I've started noticing a leak of some sort. After about a day and a half, the Modbro app on the pi crahses, I can still access it through SSH to reboot the device. Also, as the day goes on, the gauges start to lag and stop responding. If i switch themes at this point, it resets and everything moves again smoothly.
The only unusual thing i've done was load a third party display driver for the panel as the built in ones don't support it, and it was able to run the default themes for weeks without issue.
The display driver normally shouldn't affect the MoBro app in any way. So this sounds more like maybe a memory leak or something similar in the new customizable themes.
We will look into this and I will also leave my Pi running for a longer time to see if we can reproduce this and narrow down the cause.
Which Raspberry Pi model are you using?
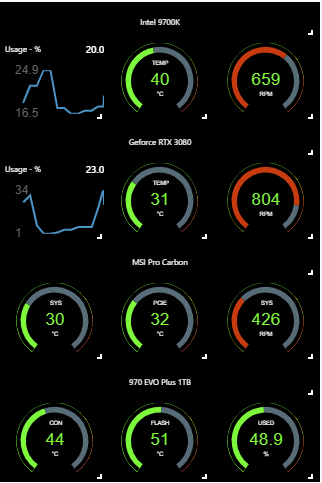
Also how many values and/or gauges did you add to the theme approximately?
Anyway, thanks for reporting this issue!
I'm using a repurposed pi 3 b+. I'm going to flip back to “Old Dubbadhar” which seems to run fine and want to test to make sure it associated to the new theme and not something else i might have changed without realizing it.
Here is a screenshot of my layout. total of 12 gauges. The FAN gauges are also a little wonky considering they can go up to 1800 RPM
Yeah that would be nice to test, so we can know for sure.
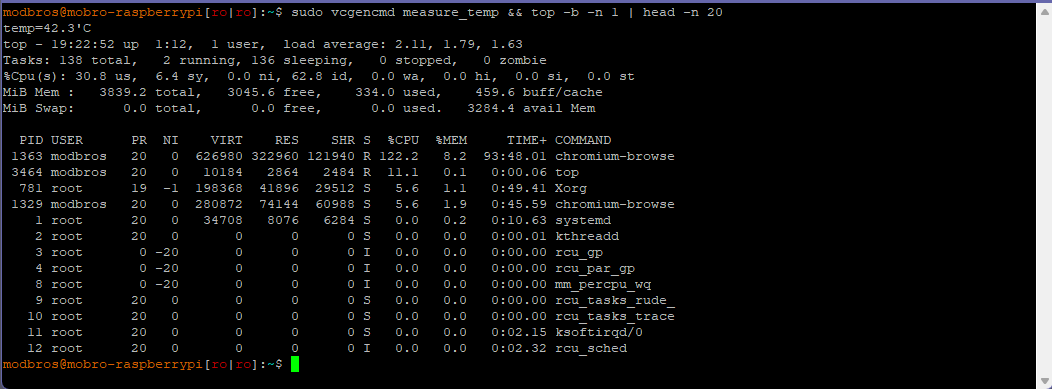
If it turns out to happen indeed only for the new theme: Could you please SSH to the Pi the next time it freezes up and check both the temperature and cpu/ram usage of the Pi?
simply execute this command and post me the response please:
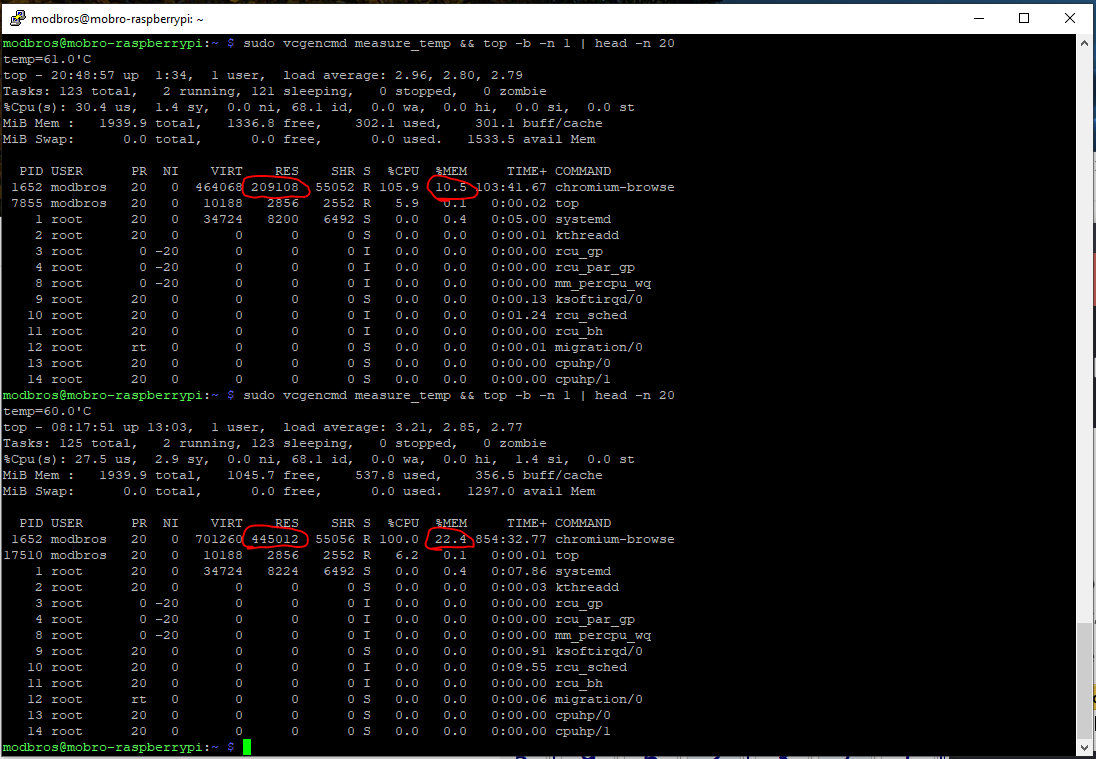
sudo vcgencmd measure_temp && top -b -n 1 | head -n 20Sure, I'll switch it to the new theme before tucking in for the night and run the command in the morning and afternoon. For references, here is the stats when running old theme.
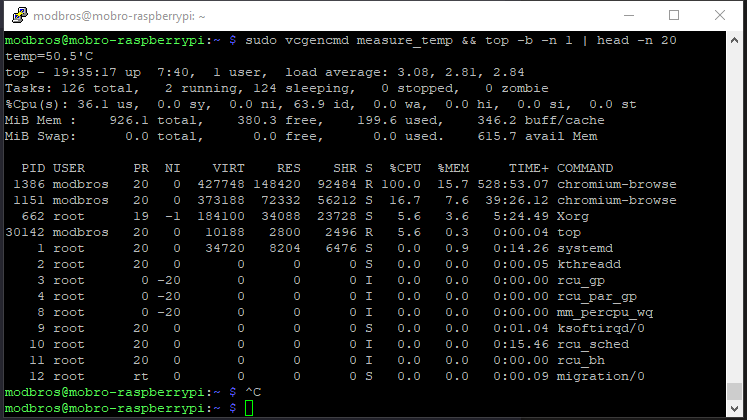
it's starting to get choppy. I also ran it in a browser (edge) and it's pretty much locked up overnight.

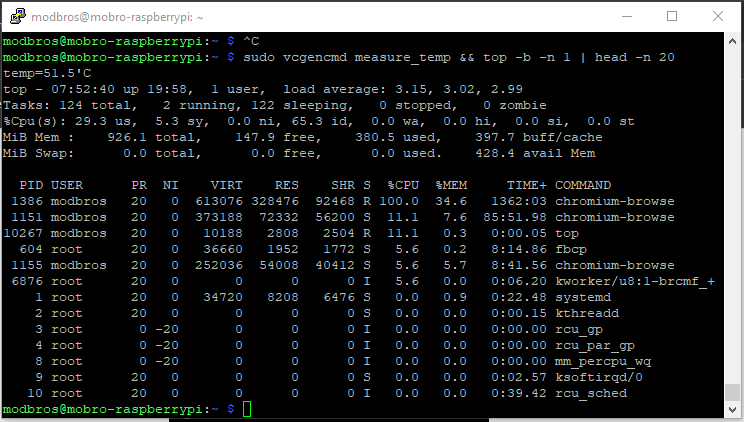
Well this doesn't look like a memory leak as I first suspected.
The temperature on the Raspberry Pi is fine and RAM usage does also look good on both the Pi and the browser on your PC.
However CPU usage seems too high here as it looks like the chromium and edge tab are both utilizing a full core to 100%.
That would also explain the choppy theme or even the complete freezing.
We will have to test and take a closer look so we can fix this before releasing the update to the public.
Thanks again for helping out and providing the screenshots ?
No wrorries. I have a Pi 4 coming in soon for another project and can test that out to see if it makes a different. If you need any files or more info, please reach out, i have no issues providing whatever you need to help you out.
I was going to post new numbers for tonight, but Microsoft decided my computer needed to be rebooted today.
I upgraded to a Pi 4 with 2 GB of RAM for this project and it's making it longer so far. Now, if i'm looking at the right, the amount of RAM usage has gone up by 200 megs in the past 13 hours?
Alright, update time:
This is a bug specific to the new dubbadhar theme. The theme is updating the data and thereby all the graphs every second like it should, but that updating somehow takes slightly longer than a second.
So new updates come in before the old ones are done, which then piles up until the CPU core is pinned to 100% and the whole thing slows down and finally completely freezes.
We're currently looking for the root cause as normally updating the values should only take a fraction of a second.
This will be fixed latest for the public release of the theme customization :)
Hi! any news on the subject?
I have the very same problem: refresh rate progressively slows down to finally stop.
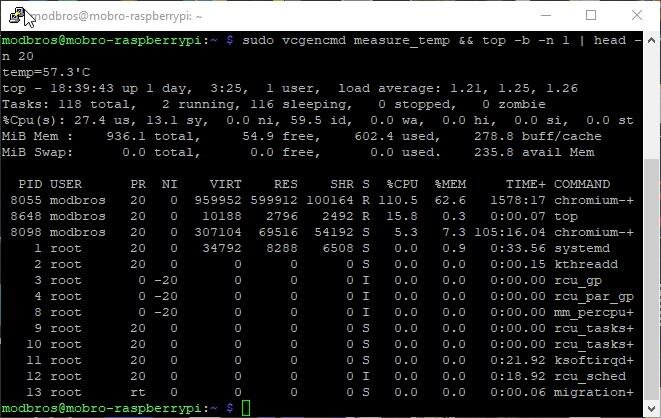
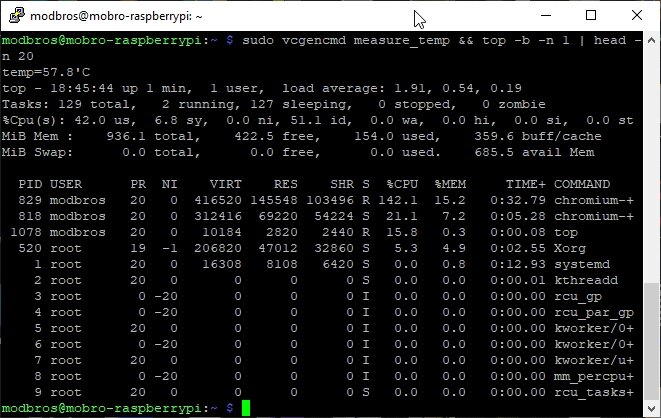
after rebooting.
Yes, sadly that's still an issue :(
We couldn't find an easy and quick fix for this
So we basically had to rebuild the entire dubbadhar theme using another charting library, which was quite a bit of effort
But we're pretty much done and so it shouldn't be too long now
Sorry for not updating you guys earlier on this
As this issue is limited to the dubbadhar theme, you could switch to the default one as a temporary solution, until we roll out the rebuilt dubbadhar theme
Looks to me chromium eating up resources. Maybe a script to restart browser every hr or when 50% memory usage?
Yes, sadly that's still an issue :(
We couldn't find an easy and quick fix for this
So we basically had to rebuild the entire dubbadhar theme using another charting library, which was quite a bit of effort
But we're pretty much done and so it shouldn't be too long now
Sorry for not updating you guys earlier on this
As this issue is limited to the dubbadhar theme, you could switch to the default one as a temporary solution, until we roll out the rebuilt dubbadhar theme
